Waihopai-Runaka-Analytics-Project
Introduction & Background
Te Rūnaka o Waihōpai is based in Southland with the Murihiku Marae situated in Invercargill serving as its cultural heart . Over the last 8 years, Waihopai Rūnaka have been working on the redevelopment of the Murihiku Marae. This rebuild will demolish existing buildings to build a sustainable cultural and community hub. Marking the beginning of a new journey for Waihōpai Rūnaka (‘the Rūnaka’) in meeting the needs of the Rūnaka and local communities for now and future generations. The Rūnaka have asked for our expertise to help them in providing an understanding of the value added by the redevelopment of Murihiku Marae using data visualisation tools. For confidentiality purposes, I will not go through the data acquisition process as well as the data cleaning process for the project in this article. I will instead focus on how I design and develop a performance measurement dashboard.
Design Thinking Process
I apply the Design Thinking process (Figure 1) to approach this project.
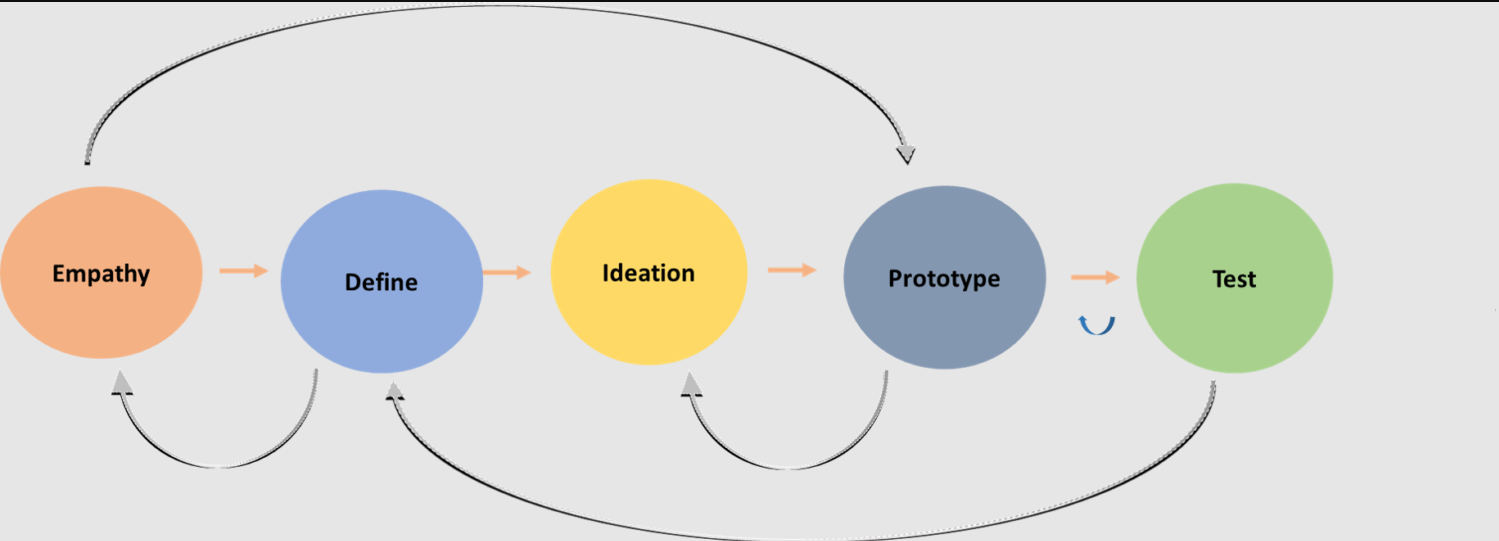
I followed a design thinking framework to develop the dashboard. This consists of five elements: (1) empathise with the dashboard users, (2) define the questions users would want to answer with the dashboard, (3) ideate as many ideas as I can, (4) prototype the dashboard, and (5) test the prototype with the internal team and then with the Rūnaka team.
Note: Design thinking is not a linear, step-by-step process, for example, I empathize with the users, then define the problem, and I present the problem to the end users to get feedback. Then, I come back to really empathize and understand the deepest needs of the end users. I continue this process until the core problem is addressed.
Persona mapping
To empathize and define the problem, I employed a persona definition process mapping, this consists of four elements: defining users, identify a set of questions users would want to answer, the third element considered what factors might impact on the experience of using the dashboard, and the final element considers how the dashboard would be used in practice. Below is a animated gif showing the persona mapping (Figure 2).
Dashboard structure
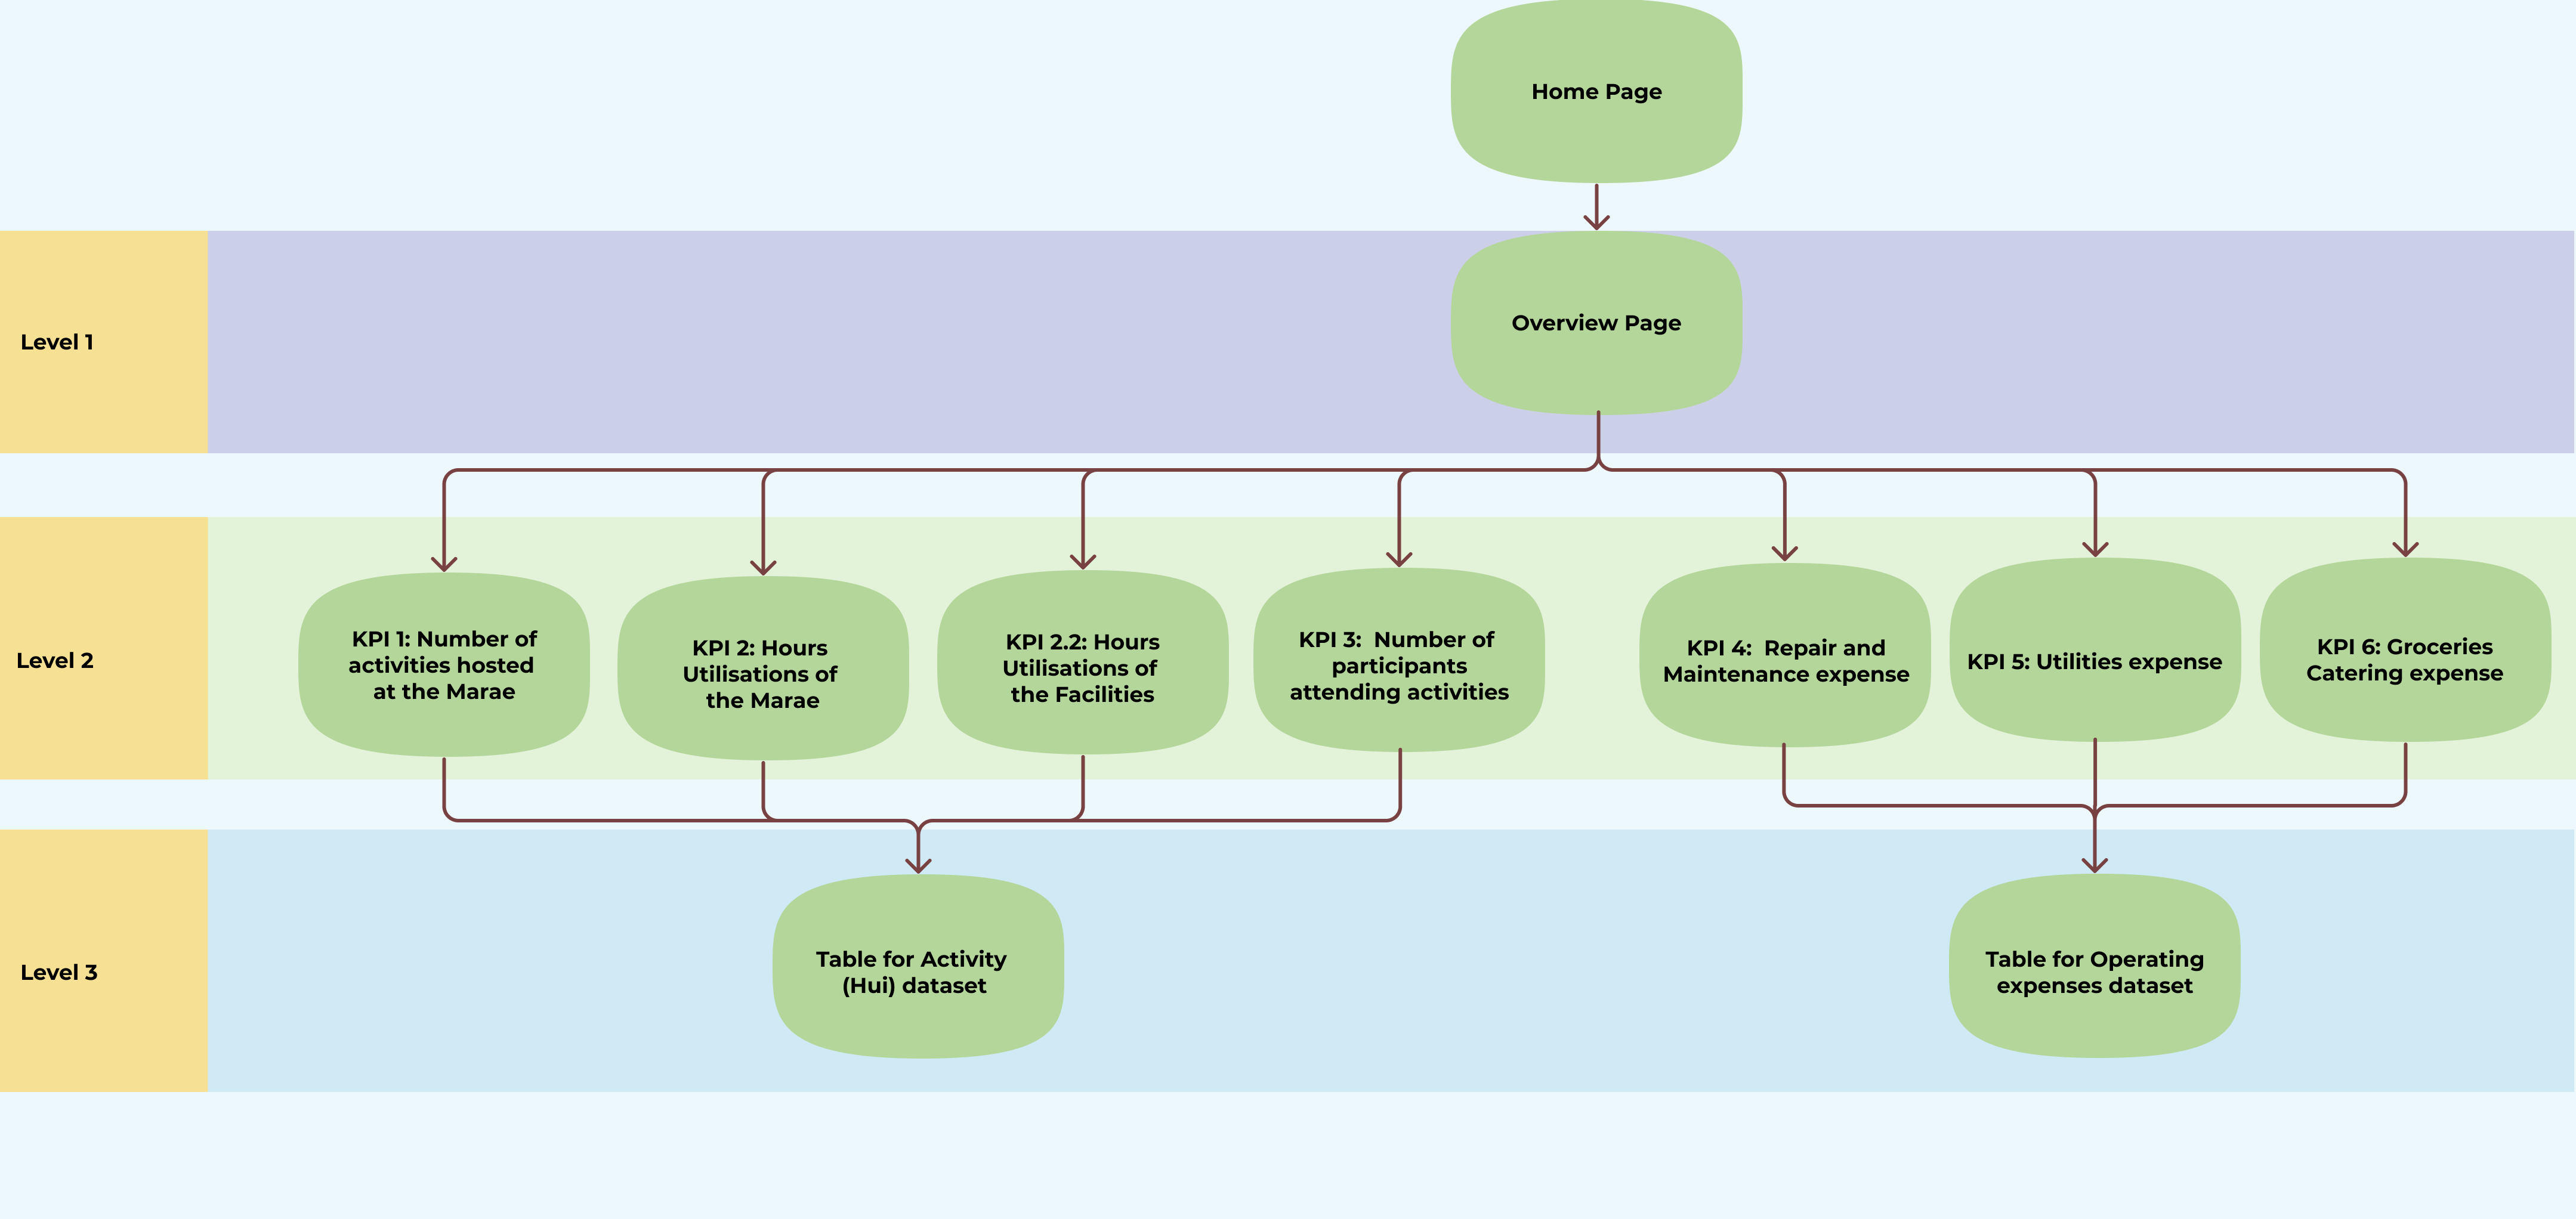
Next, I created a dashboard structure which maps out the structure of the dashboard (Figure 3). This shows a hierarchical structure that provides different views as you drill down into the data. This enables the end users to look at the data and interrogate it
Dashboard prototype
A prototype can be created at very early phases of the project. And I did create a minimum-viable-product at the beginning of the project to see what is possible and to explore ideas I may have. It is very useful to have a concrete example of what the end result would look like even at the very beginning. However, following the design thinking framework allow me to see what the users actually need rather than what I think they should use. Hence, I developed a new prototype dashboard that takes into account the understandings of end uders and the core problems identified and to be addressed by the dashboard.
Two-way communications and multiple testing and feedback sessions occur in this phase of the project
Final deliverable
Finally, I deliver the final performance dashboard to the end users at the Runaka. Below is a brief showcase of the end product. (Figure 4)
Notice: all the data in this dashboard is fake data, the dashboard is just a working prototype.
alexsonphoenix